
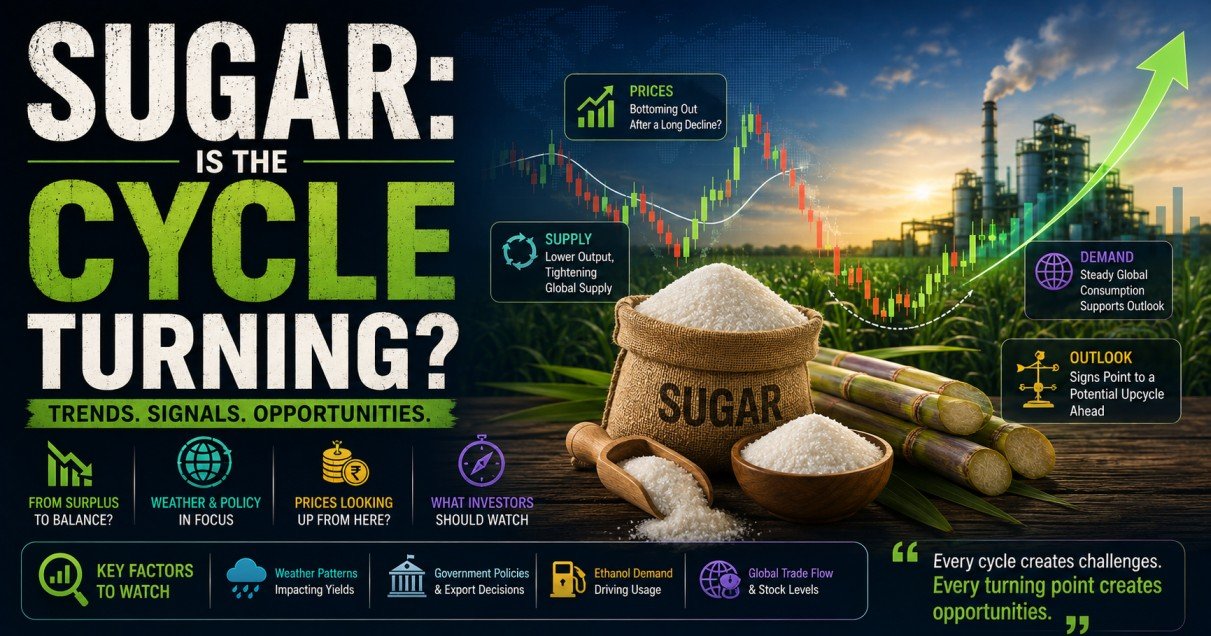
The price of sugar depends on one thing: how much sugar the world produces versus how much it consumes. The factors that affect production include weather, availability of cane, recovery, diversion of cane to ethanol, policy, and inventories.
Thank you for reading this post, don't forget to subscribe!What makes this current sugar cycle unique is the tightening of supply from several key producers. Thailand and the European Union are expected to produce less, while India is producing much less. Brazil has a bumper cane crop but is using more cane in ethanol production.
What matters most to investors is not simply whether sugar production is increasing or decreasing. What matters most is whether these supply dynamics can translate into increased sugar realizations for sugar companies.
1. Global Sugar Supply-Demand Balance
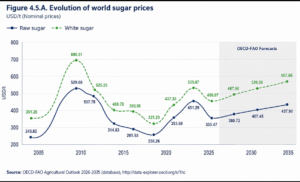
Sugar production in the world has been averaging approximately 179.8 MMT over the last 10 years (MY2016-25). Sugar production has grown from 180.35 MMT in 2024/25 to 186.06 MMT in 2025/26, which marks 3.2% year-over-year growth and about 3.5% growth compared to the 10-year average.
Consumption has also grown from 175.40 MMT to 179.93 MMT, marking 2.6% year-over-year growth. Nevertheless, the growth in production has outpaced that in consumption, thereby raising the global surplus from 5.0 MMT to 6.1 MMT.
For the coming season 2026/27, USDA predicts:
- Production: 184.85 MMT (-0.6% YoY)
- Consumption: 179.99 MMT
- Exports: 62.32 MMT (versus 62.64 MMT previously)
This will still be a global surplus. However, the headline global surplus doesn’t give the whole picture. The point is not the location of the sugar production, but the portion of the production that can become exportable supply.
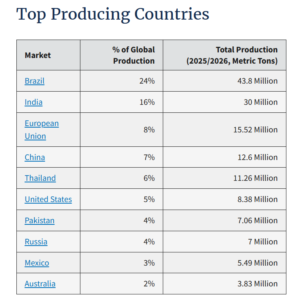
Brazil, India, the EU, China and Thailand comprise approximately 61% of the global production.
- Brazil: 24%
- India: 16%
- EU: 8%
- China: 7%
- Thailand: 6%
These regions therefore determine much of the global supply outlook.
2. Major Producing Regions
Brazil: More Cane Does Not Necessarily Mean More Sugar
Brazil is the biggest sugar producer and also the biggest exporter in the world. Consequently, its sugar versus ethanol dilemma will influence global prices significantly.
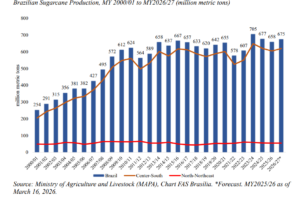
USDA projects Brazil’s sugar production in 2026/27 at 42.5 MMT, which is about a 1.3 MMT, or 3% YoY, decline despite very favorable cane availability.
Brazilian CONAB forecast for its crop 2026/27 looks like this:
- Cane production: 705.2 MMT, +4.7% YoY
- Sugar production: 42.89 MMT, -2.9%
- Cane-based ethanol: 29.98 billion liters, +9.7%
- Ethanol total: 41.88 billion liters, +11.7%
This results in the following interesting combination:
Cane production +4.7%, Sugar production -2.9%, Cane ethanol +9.7%
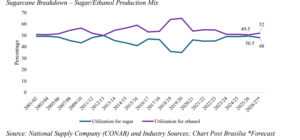
Why? Because there is a growing share of cane in ethanol production.
The Center-South area is responsible for almost 90% of Brazilian sugar and cane production. The state of São Paulo plays a particularly prominent role; its cane production in 2026/27 should be around 362.8 MMT.
Weather is always the key monitor here. The rainy season was more than normal in some regions of São Paulo and led to delays in harvesting and can affect sugar concentration and ATR at the same time. Meanwhile, according to the latest CONAB forecast, national productivity is expected to increase to 77.9 tonnes/ha, or 3.6% YoY.
Sugar vs Ethanol: The Key Variable
Brazil mills have the ability to divert cane production into either sugar or ethanol. In the case where sugar prices are weak:
Sugar production loses attractiveness; ethanol gains attractiveness; more cane will be used in the production of ethanol; sugar production is reduced.
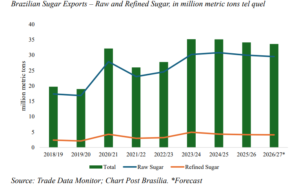
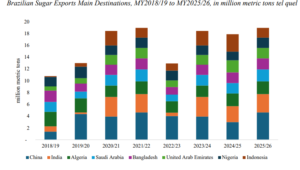
This inherent nature protects against the problem where a big cane harvest may result in increased sugar production. There is also increased support for the demand side of ethanol. Effective from 1st August 2026, Brazil has raised the ethanol blending mandate from 30% to 32% (E32) for 180 days, potentially extending. This increased ethanol mandate could help maintain high ethanol production. Brazil exports are estimated at 33.6 MMT, making Brazil’s production mix critical for the global market.
Investment Views on Brazil
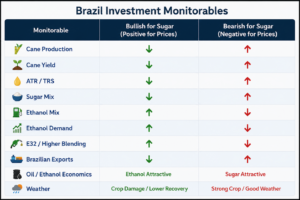
There are two conflicting factors.
Bearish:
- Large cane crop
- Increased productivity
- Possibly strong crushing
Bullish:
- Sugar production is down despite increased cane production
- Ethanol production is up
- E32 raises ethanol demand domestically
Hence, investors should pay attention to sugar mix, ethanol economics, and TRS/ATR, instead of just focusing on cane production.
Thailand: A Clear Supply-Side Negative
Production of sugar in Thailand in 2026/27 is expected to be 9.5 MMT, down by 1.8 MMT or 16%. The main reason for the decrease in production is attributed to smaller plantation areas. This is due to the Thai government maintaining cane prices that are below cost levels at farms, making it less attractive for farmers to plant cane; some farmers have opted for cassava instead.
The Thai government has also encouraged producers to reduce exports and accumulate stocks.
Investment standpoint: Thailand is currently a bullish influence on world sugar prices since there is an expected 16% fall in production.
China: Largely Neutral
Sugar production in China in 2026/27 is forecast to stay steady at 12.7 MMT. Optimal conditions for cultivation, steady acreage, and government subsidies will help in achieving this target. It seems that China is not creating a huge supply shock for the world market.
Investment Outlook: Neutral.
European Union: Lower Beet Production
EU sugar production will be lower by 1.2 million metric tons (MMT) to 14.4 MMT in 2026/27. Due to low prices and high input costs, farmers will move from sugar beet cultivation to other crops. As a result, imports will increase, and exports will fall.
Investment view: Low sugar production in the EU will be positive for world sugar prices, especially white sugar prices.
3. India: The Core of the Sugar Thesis
The Indian sugar industry operates based on three major sources of revenue:
Sugarcane Sugar + Ethanol + Power
Sugar production depends mainly on:
Cane crushed × Sugar recovery
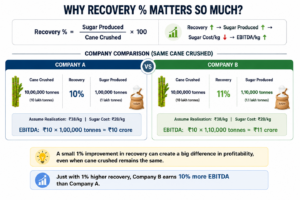
That’s why cane production per se does not influence profitability. Different amounts of profit may be received from mills crushing an equal quantity of cane depending on recovery, sugar realisation, cane costs, and ethanol economics.
Why Recovery Matters
Recovery is the sugar obtained by processing the cane. Thus, if a mill crushes 100 tonnes of cane and gets 10% recovery, it produces about 10 tonnes of sugar.
Which means that:
Higher recovery More sugar produced from the same cane Lower sugar cost per kg Higher EBITDA/kg Recovery depends on rainfall, maturity of the cane, diseases, variety of the cane, and days passed since its cutting.
The crucial investment chain includes:
- Rainfall
- Cane yield
- Cane availability
- Crushing
- Recovery
- Sugar production
- Sugar realisation
- EBITDA
Another investment chain also has to be taken into consideration:
- Cane
- Ethanol diversion
- Sugar availability
- Sugar prices
4. India’s Production Shortfall
India regularly produces 320-340 LMT of sugar while its consumption is estimated to be around 280-290 LMT. However, in the most recent estimates, the country’s sugar production was pegged at 306 LMT, way down from the initial estimates of 343 LMT.
The reasons behind the shortage of sugar include:
- Red Rot
- Top Borer
- Heavy rains and waterlogging
- Inadequate cane supplies
- Weather damage
It is expected that sugar stocks in Balrampur Chini Mills will be tight, possibly extending into October 2027, to healthier levels, with closing stock standing at 3 MMT. The world sugar deficit for the 2026/27 season is estimated at 33 LMT. This explains why the country’s production and stock levels are a positive force for sugar pricing.
5. State-wise Supply Outlook
Maharashtra
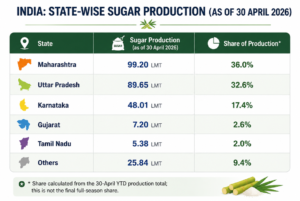
Maharashtra had managed to produce 99.2 LMT by 30 April 2026, which was the highest amongst all the big states. Strangely enough, there has been an increase in the production of cane in Maharashtra from 1,099.7 LMT in 2024/25 to 1,316.49 LMT in 2025/26. Sugar recovery stands at 11.26%. Nevertheless, there is a shortage of sugar, and there have been sharp rises in price levels.
Uttar Pradesh
Production in UP reached 89.65 LMT by 30 April 2026. Around 28.14 lakh hectares will be cultivated under sugarcane, while production is expected to be around 90 LMT. Area under cane cultivation has been reduced from 28.61 lakh hectares to 28.14 lakh hectares, resulting in a reduction of about 47,000 hectares.
The bigger problem for UP mills is that of cane cost. For 2025/26, the state has increased SAP to:
Early Varieties: ₹400/qtl
Normal Varieties: ₹390/qtl
This is quite higher than the central FRP. UP has replaced the variety CO-0238 due to its sensitivity to Red Rot.
Monitorables: SAP, recovery, disease, and cane availability.
Karnataka
Karnataka has recorded 48.01 LMT up to 30 April 2026. Rain, disease, and cane availability are the primary worries. According to the Karnataka State Sugarcane Growers’ Association, cane production may be down by about 30%, falling from roughly 5.8 crore tonnes to 5 crore tonnes. This is the prediction of an industry body and not that of the government.
The price of sugar has also gone up significantly, with the price being quoted between ₹45/kg and ₹63/kg.
Monitorables: Rain, cane availability, and recovery.
Tamil Nadu
Tamil Nadu is smaller than Maharashtra, UP and Karnataka, but still remains a good regional indicator. Sugar prices have risen steeply, and fears of shortage of cane, rainfall and demand persist. The state also allows for special-season crushing, enabling some sugar mills to crush during the special season.
Monitorables include rainfall, cane shortage, and special-season crushing.
6. Government Policy: The Biggest Wild Card
Government policies greatly influence India’s sugar sector. For 2026/27, the government has set FRP as follows:
₹365/qtl for 10.25% basic recovery
For each 0.1% above the basic recovery of 10.25%, the farmers get ₹3.56/qtl. For each 0.1% below the basic recovery of 10.25%, the FRP falls by the same rate, with a safety net available for recovery of 9.5%. FRP last year stood at ₹355/qtl. This shows that the latest FRP is 2.8% higher than last year’s FRP.
High cane prices are not favorable for mills if sugar prices do not increase in the same proportion.
7. Government Intervention on Sugar Prices
With the prices of sugar increasing significantly, the government has come up with some policies, including the following:
- 1. Stock of dealers: 400 tonnes between 1 August and 30 November 2026
- 2. Bulk consumers: 15 days of consumption as of 1 September
- 3. Seven-day lifting policy: Buyers must lift the sugar after seven days
- 4. Physical inventory checks: The government has started verifying inventories
- 5. Duty-free imports: 10 LMT of raw sugar allowed
- 6. Early crushing: Mills are urged to start crushing their products from 15 October
Some of these policies are expected to have a bearish effect on the realisation of sugar because the imports, inventory and early crushing will lead to increased supplies.
However, 10 LMT is raw sugar, which has to be refined before being able to enter the white sugar market. Therefore, the impact on immediate domestic availability may take time.
8. Ethanol: Don’t Simply Call It Bullish or Bearish
The sugar industry comprises ethanol; however, the role of ethanol needs careful assessment.
As per the government statistics, it can be seen that the diversion of sugar towards ethanol has gone down to 9% in 2025/26 from 12% in 2022/23. On the other hand, three-fourths of the ethanol produced now uses grains, mainly maize.
Moreover, India has been successful in achieving about 20% ethanol blending in ESY 2025/26.
Indicative ethanol procurement prices for ESY 2025/26 are:
Feedstock Ethanol price
Maize ₹71.86/L
Sugarcane juice/syrup ₹65.61/L
Damaged food grains ₹64.00/L
B-heavy molasses ₹60.73/L
FCI rice ₹60.32/L
C-heavy molasses ₹57.97/L
This means that maize is the most expensive raw material amongst these raw materials. The government’s policy is becoming more and more oriented towards diversifying the raw materials used so that the blending of ethanol will increase without unduly taking away sugarcane from sugar production.
In cases where there are high sugar prices, it is possible that sugar will be more lucrative than ethanol. Hence, ethanol is beneficial to diversification of revenue streams and cash flow, but diversion of cane is not necessarily beneficial to sugar earnings.
9. What Does This Mean for Sugar Companies?
The bullish factors in the sugar cycle presently include:
- Thai sugar production reduced by 16%
- Sugar production in the EU reduced by 1.2 MMT
- Indian sugar production estimated at 306 LMT
- India still has tight sugar inventories
- Lower sugar production in Brazil even though cane production is higher
- Increased ethanol production based on cane in Brazil by 9.7%
- E32 increasing Brazilian ethanol demand
On the other hand, the following are some risks:
- Higher sugar content in Brazil
- Increased ATR/recovery
- Indian sugar production in the next season recovering sooner than expected
- Increased government imports increasing domestic supply
- Early start to crushing season providing fresh supplies of sugar
- Restrictions on sugar inventories limiting speculative buying
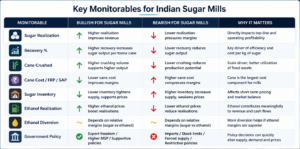
For sugar companies, the important variables are thus:
Sugar realization + recovery + cane cost + crushing volume + ethanol economics
The combination of high sugar realization and good recovery in sugar companies works very well when sugar inventories are tight. The high cane costs and poor recovery could offset much of the benefit.
Conclusion: Is the Sugar Cycle Turning?
There is a growing positive outlook for sugar, although it is not all bullish on the sugar front.
A combination of reduced production in Thailand and the EU, India’s production deficiency and inventories, as well as a large cane harvest in Brazil without sugar output increasing correspondingly due to ethanol diversion, creates a bearish outlook.
But bulls must not assume that the sugar price is going up continuously and there is no way out.
The cycle could be reversed by a significant rise in the percentage of sugar to ethanol in Brazil, improvements in the ATR/Recovery figures, faster normalization of the Indian crop compared to expectations, and successful imports via the government.
But most importantly, bulls have to see the bigger picture and consider the sugar price only as one of the key indicators in the investment decision.
Key Monitorables for the Next 12 Months
- 1. Brazil: Sugar-vs-ethanol mix, TRS/ATR, crushing and exports
- 2. India: Cane acreage, recovery, production and closing stocks
- 3. Sugar prices: Sustainability of current realizations
- 4. Government policy: Imports, stock limits, exports and ethanol regulations
- 5. Weather and diseases: Rainfall, Red Rot and Top Borer
- 6. Balance outlook: The difference between 4.9 MMT surplus expectation and reality
Therefore, the sugar thesis is not just “production is reducing, hence sugar stocks are rising.” It is whether tight supply could stay tight long enough to sustain realizations and whether the sugar companies could profit from the situation due to higher cane prices and changed ethanol economics.
If you need guidance on how to start your stock market journey, how much capital is enough to begin with, how to do smart investing, or how to take informed stock market decisions, you can join Strategic Alpha’s ‘The Conviction Club’. This is a membership program, especially curated to help investors become aware and knowledgeable about stock market trends, news, and technical aspects, so that they can become their own experts.
Our YouTube channel, weekly webinars, and digital resources available on the website can help you learn the basics of the stock market. For regular updates on trends, one-to-one sessions with experts, and detailed learning modules, you can join the Conviction Club, which is the online community of like-minded investors sharing knowledge and thoughts to grow together.
Subscribe to the Strategic Alpha Newsletter now to get the latest updates about weekly webinars.
Join Me On My Telegram Channel Where I Share Much More Value Adding Knowledge Of Investing/ Trading: Click Here
Also, Don’t Forget To Follow Us On Our Social Media Accounts:
Facebook: https://www.facebook.com/strategicalpha/
Instagram: https://www.instagram.com/strategicalpha/
Twitter: https://twitter.com/suyog_dhavan
YouTube: https://bit.ly/2IIqztO
Disclaimer: Strategic Alpha and Suyog Dhavan are not SEBI-registered investment advisor. The content provided is purely for educational purposes and should not be construed as financial or investment advice. Viewers are encouraged to conduct their own research or consult with a SEBI-registered professional before making any investment decisions.